
Quickstart
This walks you through your first Medblocks project end to end: sign up, get data flowing, define a Table, and see results. About ten minutes.
This walks you through your first Medblocks project end to end: sign up, get data flowing, define a Table, and see results. About ten minutes.
If a term in here is unfamiliar, the Data Modelling page has the long version.
Sign up
Go to app.medblocks.com and create an account with your work email. We’ll send a verification link. Click it to confirm the address.
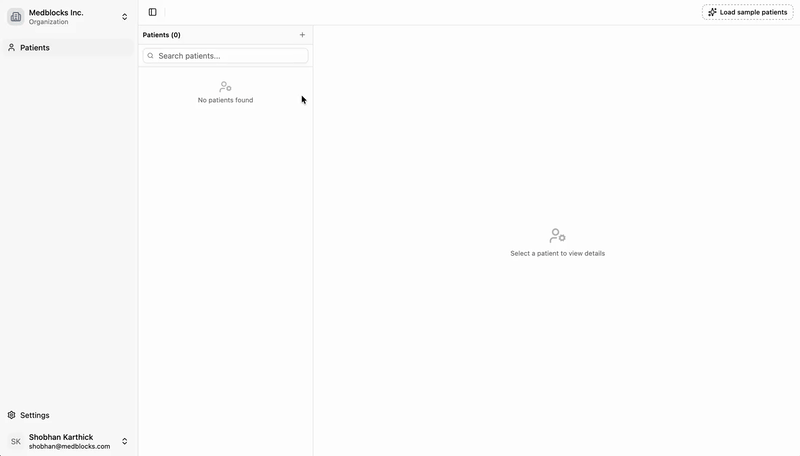
Once verified, you’re prompted to create an Organization. Give it a name (your company or team name is fine; you can change it later) and click Create. You’ll land in a fresh workspace with no Connectors and no Tables yet.
Import sample patients
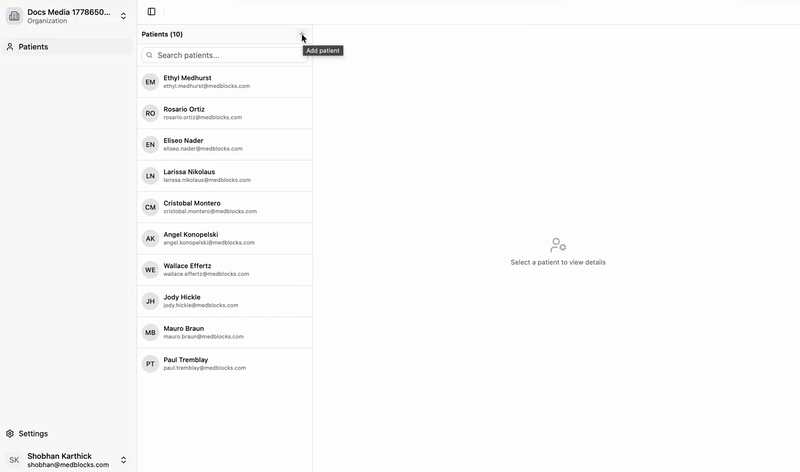
Before you connect a real system, it helps to have data to look at. From the empty workspace, click Load sample patients.
This loads a synthetic dataset of about 10 patients. The data is realistic, with FHIR resources covering encounters, conditions, observations, medications, and a handful of PDF discharge summaries, but it does not contain real PHI. You can use it to explore the platform without waiting for a real Connector to sync.
You’re now ready to define a Table. If that’s all you want to do for this first run, skip to step 4.
(Optional) Connect your own records from MyChart
If you want to see the patient-mediated flow in action, connect your own health records. This is the same flow your patients would go through.
- From the workspace home, click Add patient and fill in the patient name and email.
- On the patient page, pick your EHR from the Add EHR dropdown. Search for the Epic-based hospital you’ve been seen at.
- Click Generate link. Copy the one-time link to your clipboard.
- Open the link on your phone (or any browser). Sign in with your MyChart credentials, and approve the data-sharing scopes.
- Wait about 30 seconds. Your records land as a new Connector called
epic-patient-<your-name>and you’ll see it appear in the workspace.
You now have two Connectors, sample and your own MyChart pull, to work with.
Define your first Table
Tables are how you express what you want to know. Keep your first one simple. The table builder is still changing, so for this pass, focus on the shape of the table you want rather than exact clicks.
-
Click Tables → New Table. Name it
patient_overview. -
Add three Columns:
Name Type Description patient_nametext Patient’s full legal name. Use the most recent value if multiple sources disagree. date_of_birthdate Patient’s date of birth. last_hba1cnumeric Most recent HbA1c lab result, as a percentage. Prefer LOINC 4548-4 but accept local codes meaning the same thing. Leave null if the patient has never had one. -
Click Save.
That’s it. The Agent picks up the Table and starts working.
Watch the Agent work
You’ll see the Agent’s logs on the Runs page. It runs through the loop described in Data Modelling: profiling your Connector data, writing candidate Mappings, testing them, and iterating.
For a Table this simple on the sample dataset, expect 5-10 minutes. Real datasets with messier code systems take longer, sometimes hours. You don’t need to keep the tab open. You’ll get an email when the Mappings are done.
View the Table
Open patient_overview from the Tables dashboard. You’ll see one row per patient with the Columns you defined. Click any cell to see provenance - the input row, Mapping version, and timestamp behind the value.
Click Export CSV to download a snapshot. To push the Table out to your warehouse, a FHIR server, or object storage on a schedule, set up an Export. Start with Export for the concept and Export To S3 for a dashboard walkthrough.
Related Guides
- Add more Columns to
patient_overview: missed appointments, current medications, last visit date. - Connect a real production system through one of the EHR or HIE Connectors.
- Read Data Modelling if you skipped it, especially the sections on Mappings and Provenance.
If anything in this quickstart didn’t work the way it’s described, email us at support@medblocks.com.