Medblocks × HiGHmed: Adapting Synthea for Germany’s MII FHIR Profiles
Synthea generates brilliant synthetic patient data, but only in US Core. HiGHmed needed it in Germany's MII profiles. Here is how we rebuilt it. Fully open source.
October 8, 2026
150 GB isn’t big data. It was still enough to make Postgres hang for 50 minutes on a single query without returning a result.
That was the first wall we hit building an analytics pipeline for SPARSH Hospitals, a multi-specialty hospital group in Bengaluru that sees over 1.5 million patients a year. Rajesh, their CTO, asked us to take data from their EMR and billing system and turn it into something their analytics team could report on. It took six months and several rebuilds of the pipeline.
That’s typical of building analytics on an EMR database you didn’t design. Fields you’d count on are often empty, and records don’t always behave the way the schema suggests. Both showed up at SPARSH, and both shaped the pipeline we ended up with.
Most hospital software, including the EMR and billing system, runs on a transactional database: it records each event, like a visit or a payment, as a row the moment it happens. That makes it fast to write to and slow to analyse across millions of records.
SPARSH’s EMR and billing system, built by another vendor, stored its data in a MySQL database. That setup suited the EMR, but their analytics team needed the data restructured for reporting.
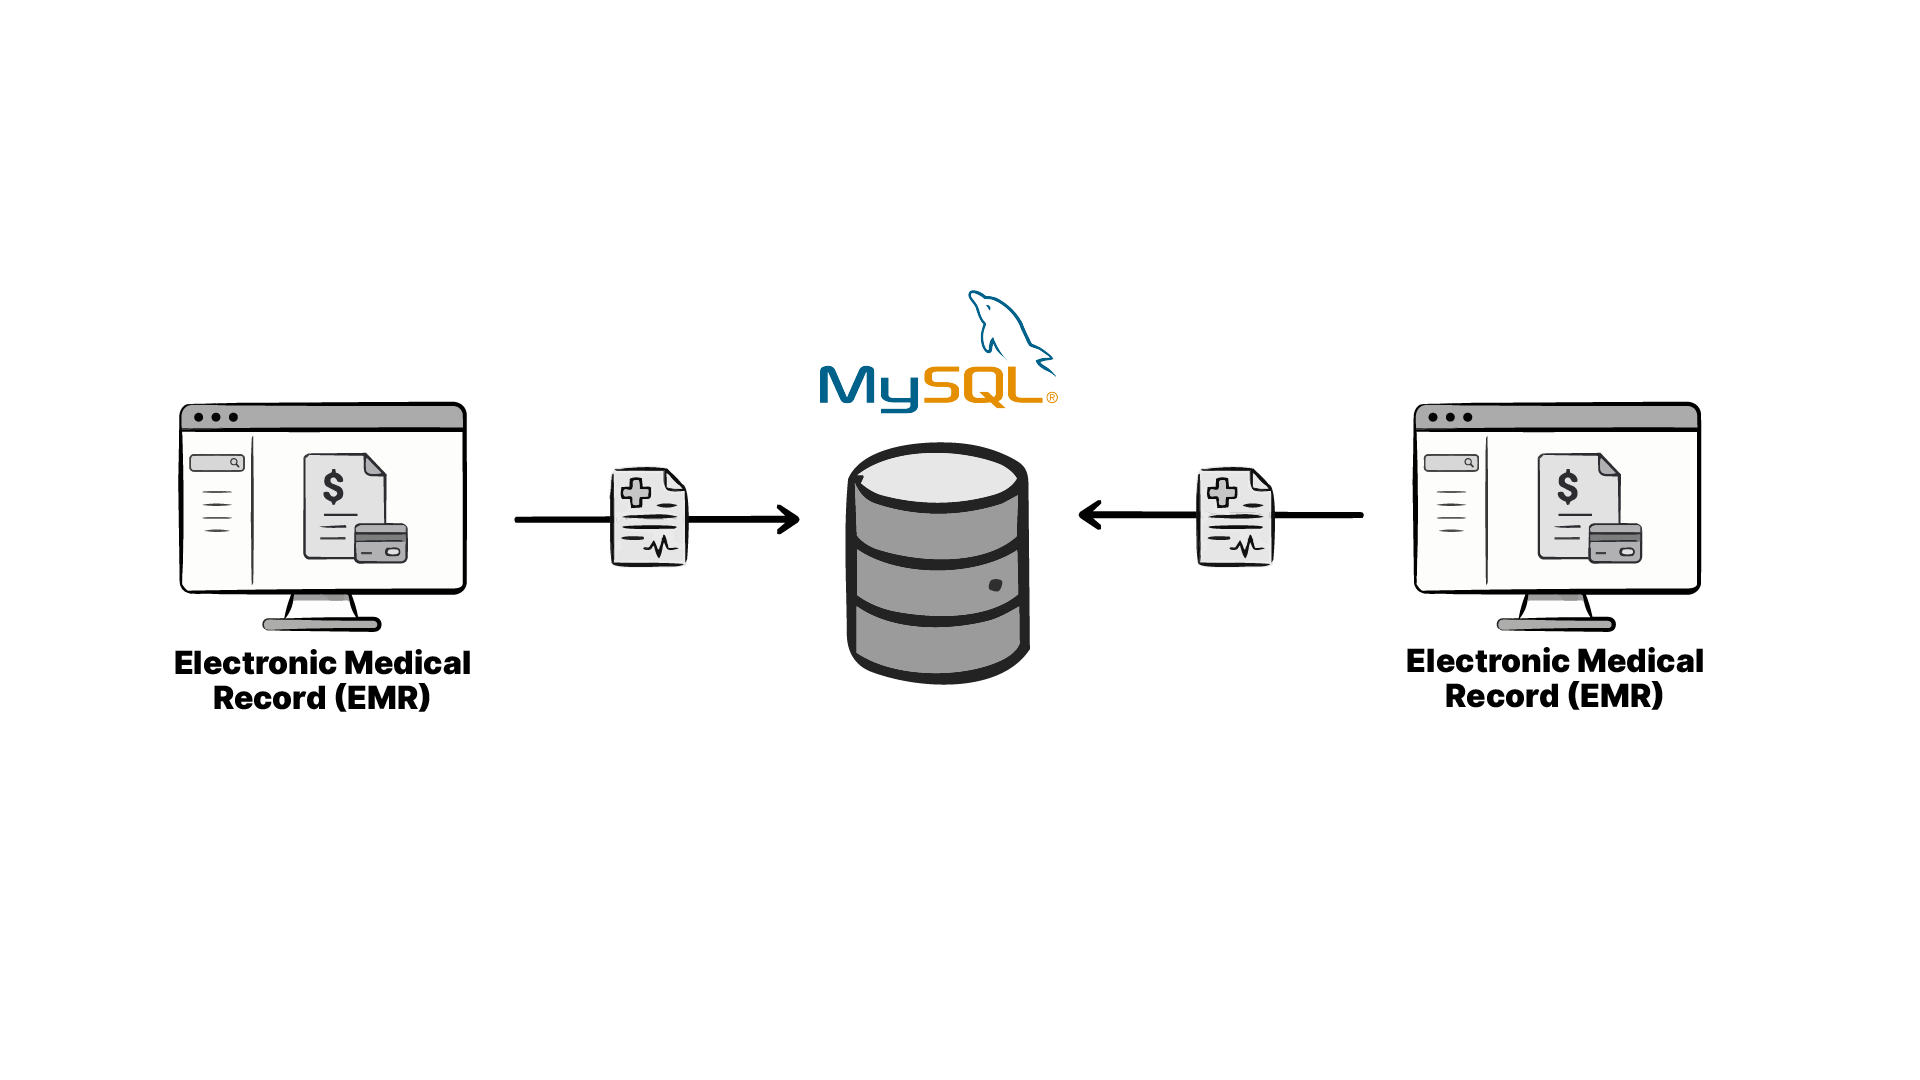
They sent us an Excel sheet listing the variables they needed and the data type for each. The output format was open: CSV files, Postgres tables, anything their business intelligence tool could read. They also used Databricks for some of their analytics.
We picked the simplest option, dlt. It’s an open-source Python library from dltHub that loads data from a source system into a destination, and it let us keep all the extraction logic in a single Python script. It would pull data incrementally, fetching only records that were new or changed since the last run based on the created_at and modified_at timestamps. That data would then load into a Postgres database. Materialized views would reshape it into the structure the analytics team wanted.
A materialized view stores the result of a query as a table. When someone loads a dashboard, it reads the stored result instead of running the full query again, and the view is refreshed when new data comes in.
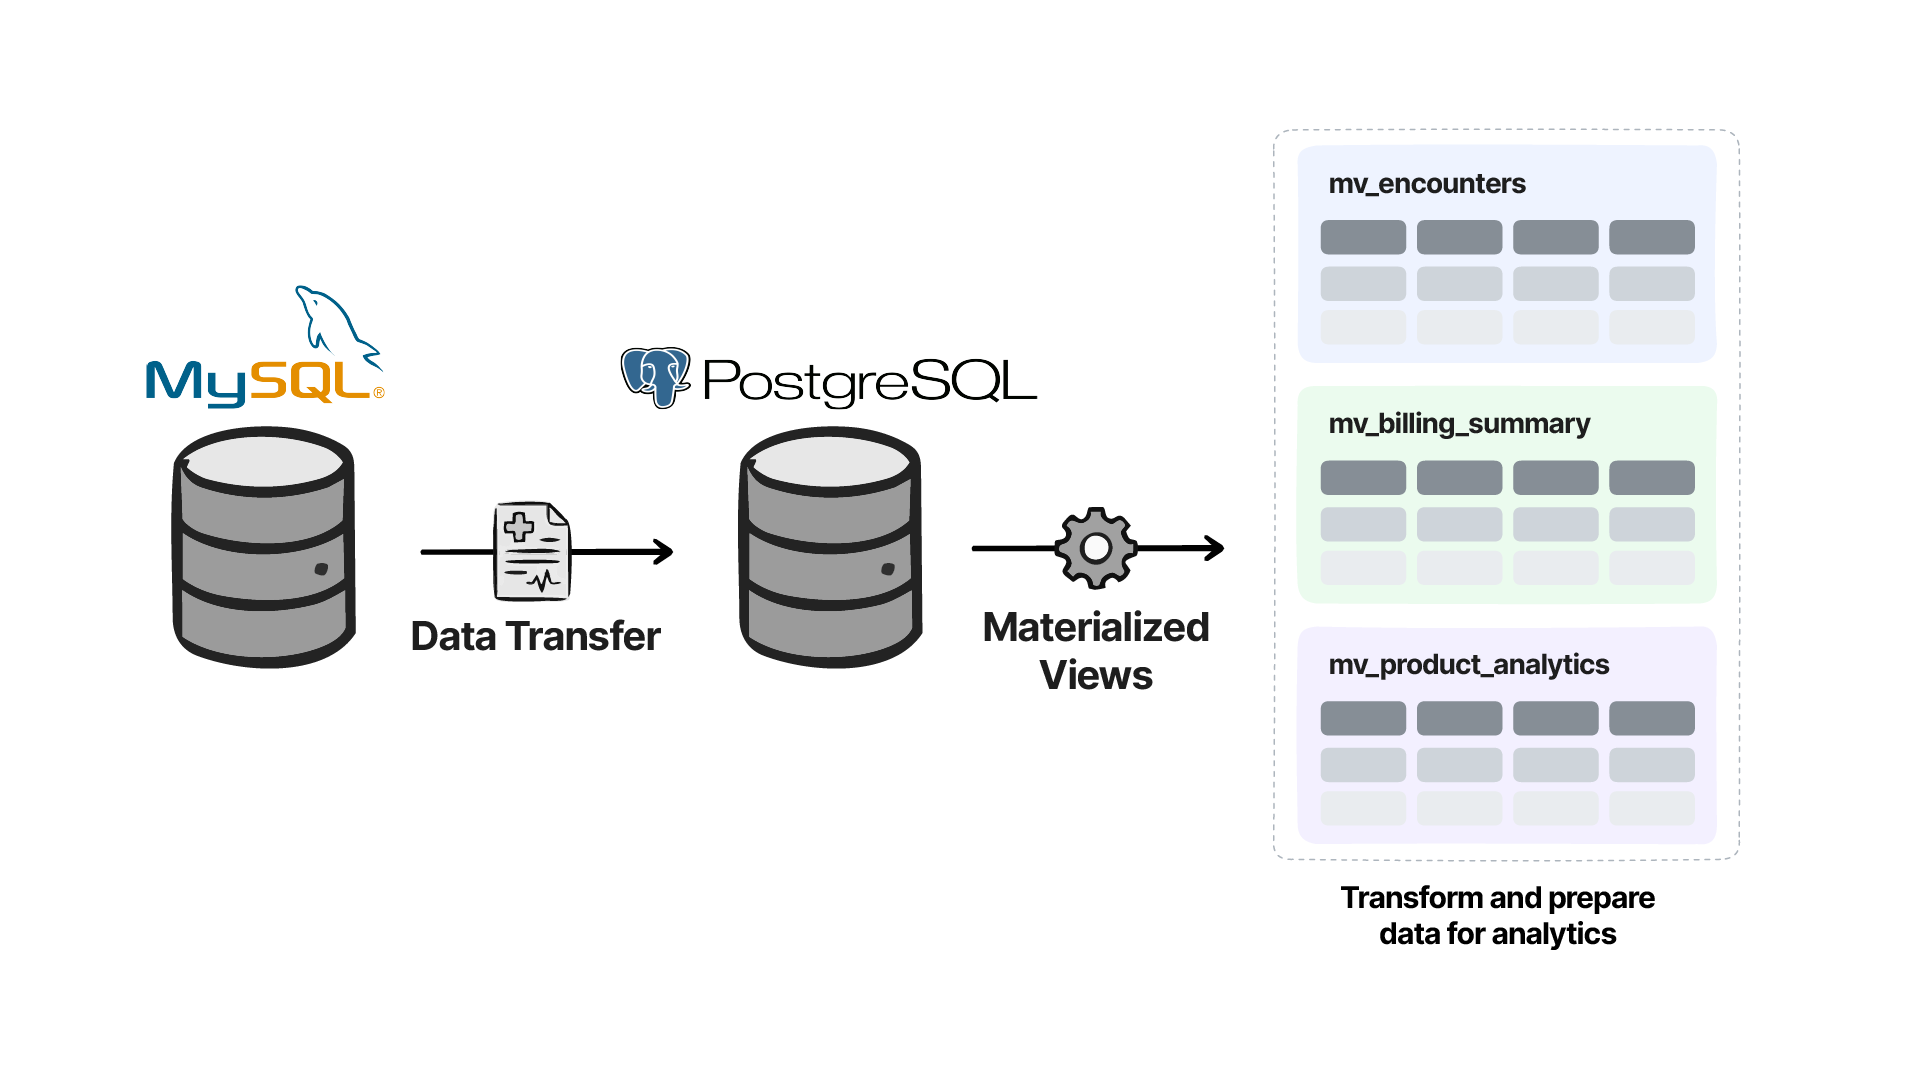
We started with the core entities (patient, encounter, location) on a single VM with 32 vCPUs. The initial loads ran without issues.
An invoice in their system wasn’t a single record. It held multiple line items, each pointing to a service, an item, a cancellation, a return, or a refund. This structure is common in billing systems.
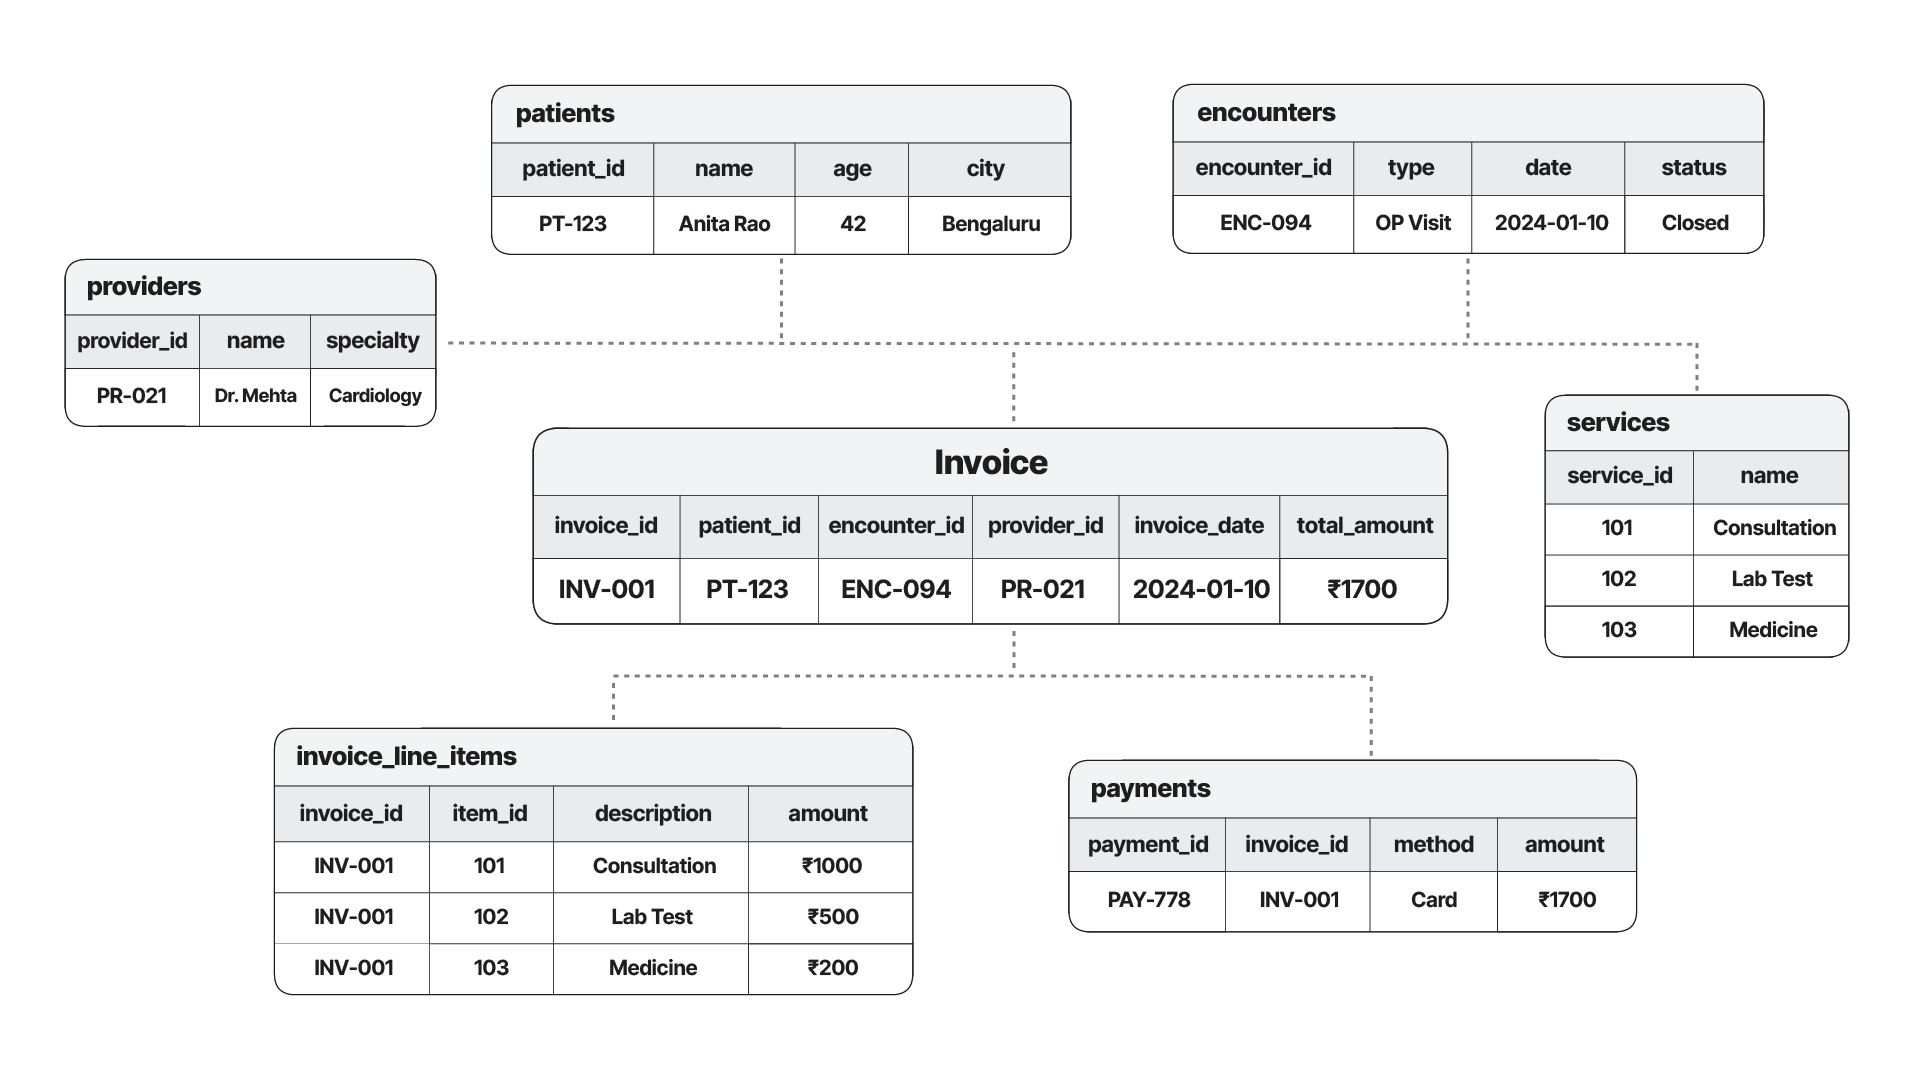
Caption: An invoice links to patients, encounters, providers, and services, and splits into line items and payments.
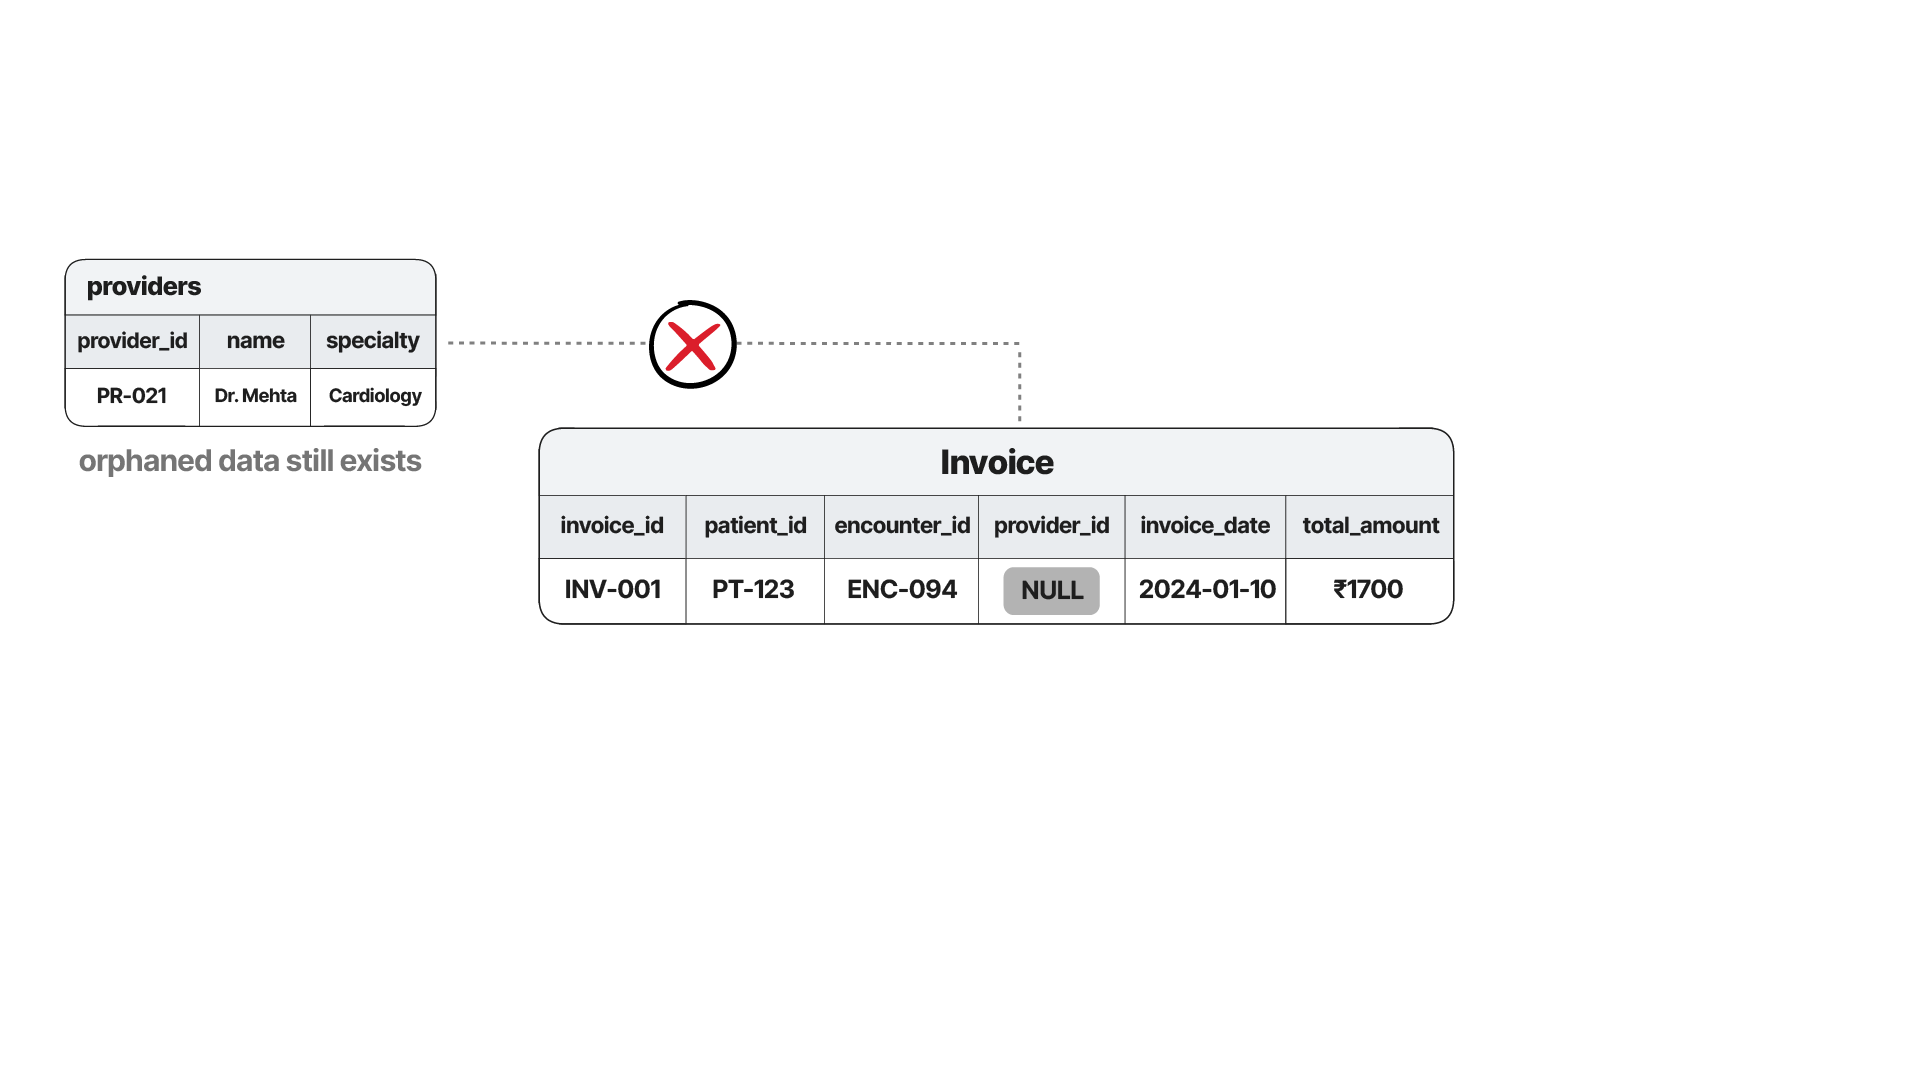
The problem was how deletions were handled. When a line item was deleted, the row stayed in the database and only its reference was set to null, leaving orphaned records in the tables.
The billing tables held close to 100 million records. We treated this as a one-time initial load, built the materialized view, and ran the query on Postgres. It ran for 40 to 50 minutes without returning a result before the system hung.
With no result to check, we had no way to iterate. We added indexes and tried other optimizations, but the tables were larger than the available RAM, and Postgres wasn’t making good use of the compute it had.
Like MySQL, Postgres is an OLTP (online transaction processing) database, so we expected it to be slow at analysing millions of records at once. We started there anyway because we always start with the simplest possible solution, and only move to something more complex once it stops working.
The second problem showed up as missing rows in the transformed data.
We went back to the source and found that many records had null values in the created_at and modified_at columns. Incremental loading in a tool like dlt depends on those columns to tell new records from old ones. Without them, and with a pipeline that had to run daily, the only safe option was to reload everything every day. That meant reloading hundreds of millions of rows across all the tables on every run.
So we moved from dlt to Airbyte, an open-source data integration platform. Airbyte uses Debezium to read the MySQL binlog, where MySQL records every change made to the database. This is change data capture (CDC): it picks up changes from the database log itself, so it doesn’t need a timestamp column to know which records changed.
We also tried tuning Postgres with PGTune, a tool that recommends configuration settings, like how much memory to allocate, based on the server’s hardware. But no configuration could make up for tables far larger than the available memory.
Then we tried TimescaleDB, a Postgres extension that speeds up queries on time-series data by partitioning tables on time. Query times dropped by 10x. But TimescaleDB needs a time or integer column to partition on, and the tables with null timestamps weren’t partitioned at all. On those, it fell back to standard Postgres behaviour, and queries were back to 40 or 50 minutes with no result.
The data was also going to keep growing, from around 150 GB at the time to potentially 1 to 10 TB within a few years. Keeping storage and compute on one machine meant scaling both together, so we needed to separate them.
We first looked at writing Parquet files directly to Amazon S3 cloud storage. Parquet stores data by column, so an analytical query only reads the columns it needs. But we’d have had to handle partitioning and schema enforcement ourselves.
Apache Iceberg, an open-source table format, handles both. It stores data as Parquet files on S3 and adds schema management, schema evolution, and transactional guarantees on top. S3 storage is cheap, and we no longer had to keep expanding a disk as the data grew.
Iceberg only stores the data, though. We still needed a query engine to run SQL on it.
We compared three engines. Apache Spark, a general-purpose data processing engine, was too complex for what were mostly SQL-focused needs. ClickHouse, a columnar analytics database, performed well but had limited Iceberg support at the time. Trino is an open-source distributed SQL engine. It could query Iceberg tables directly and supported standard SQL. Its queries could also port to Amazon Athena, AWS’s managed query service, which is built on Trino. We went with Trino.
We also moved off the single VM to a Kubernetes cluster that spins up containers to process each data load. The final pipeline runs like this every day:
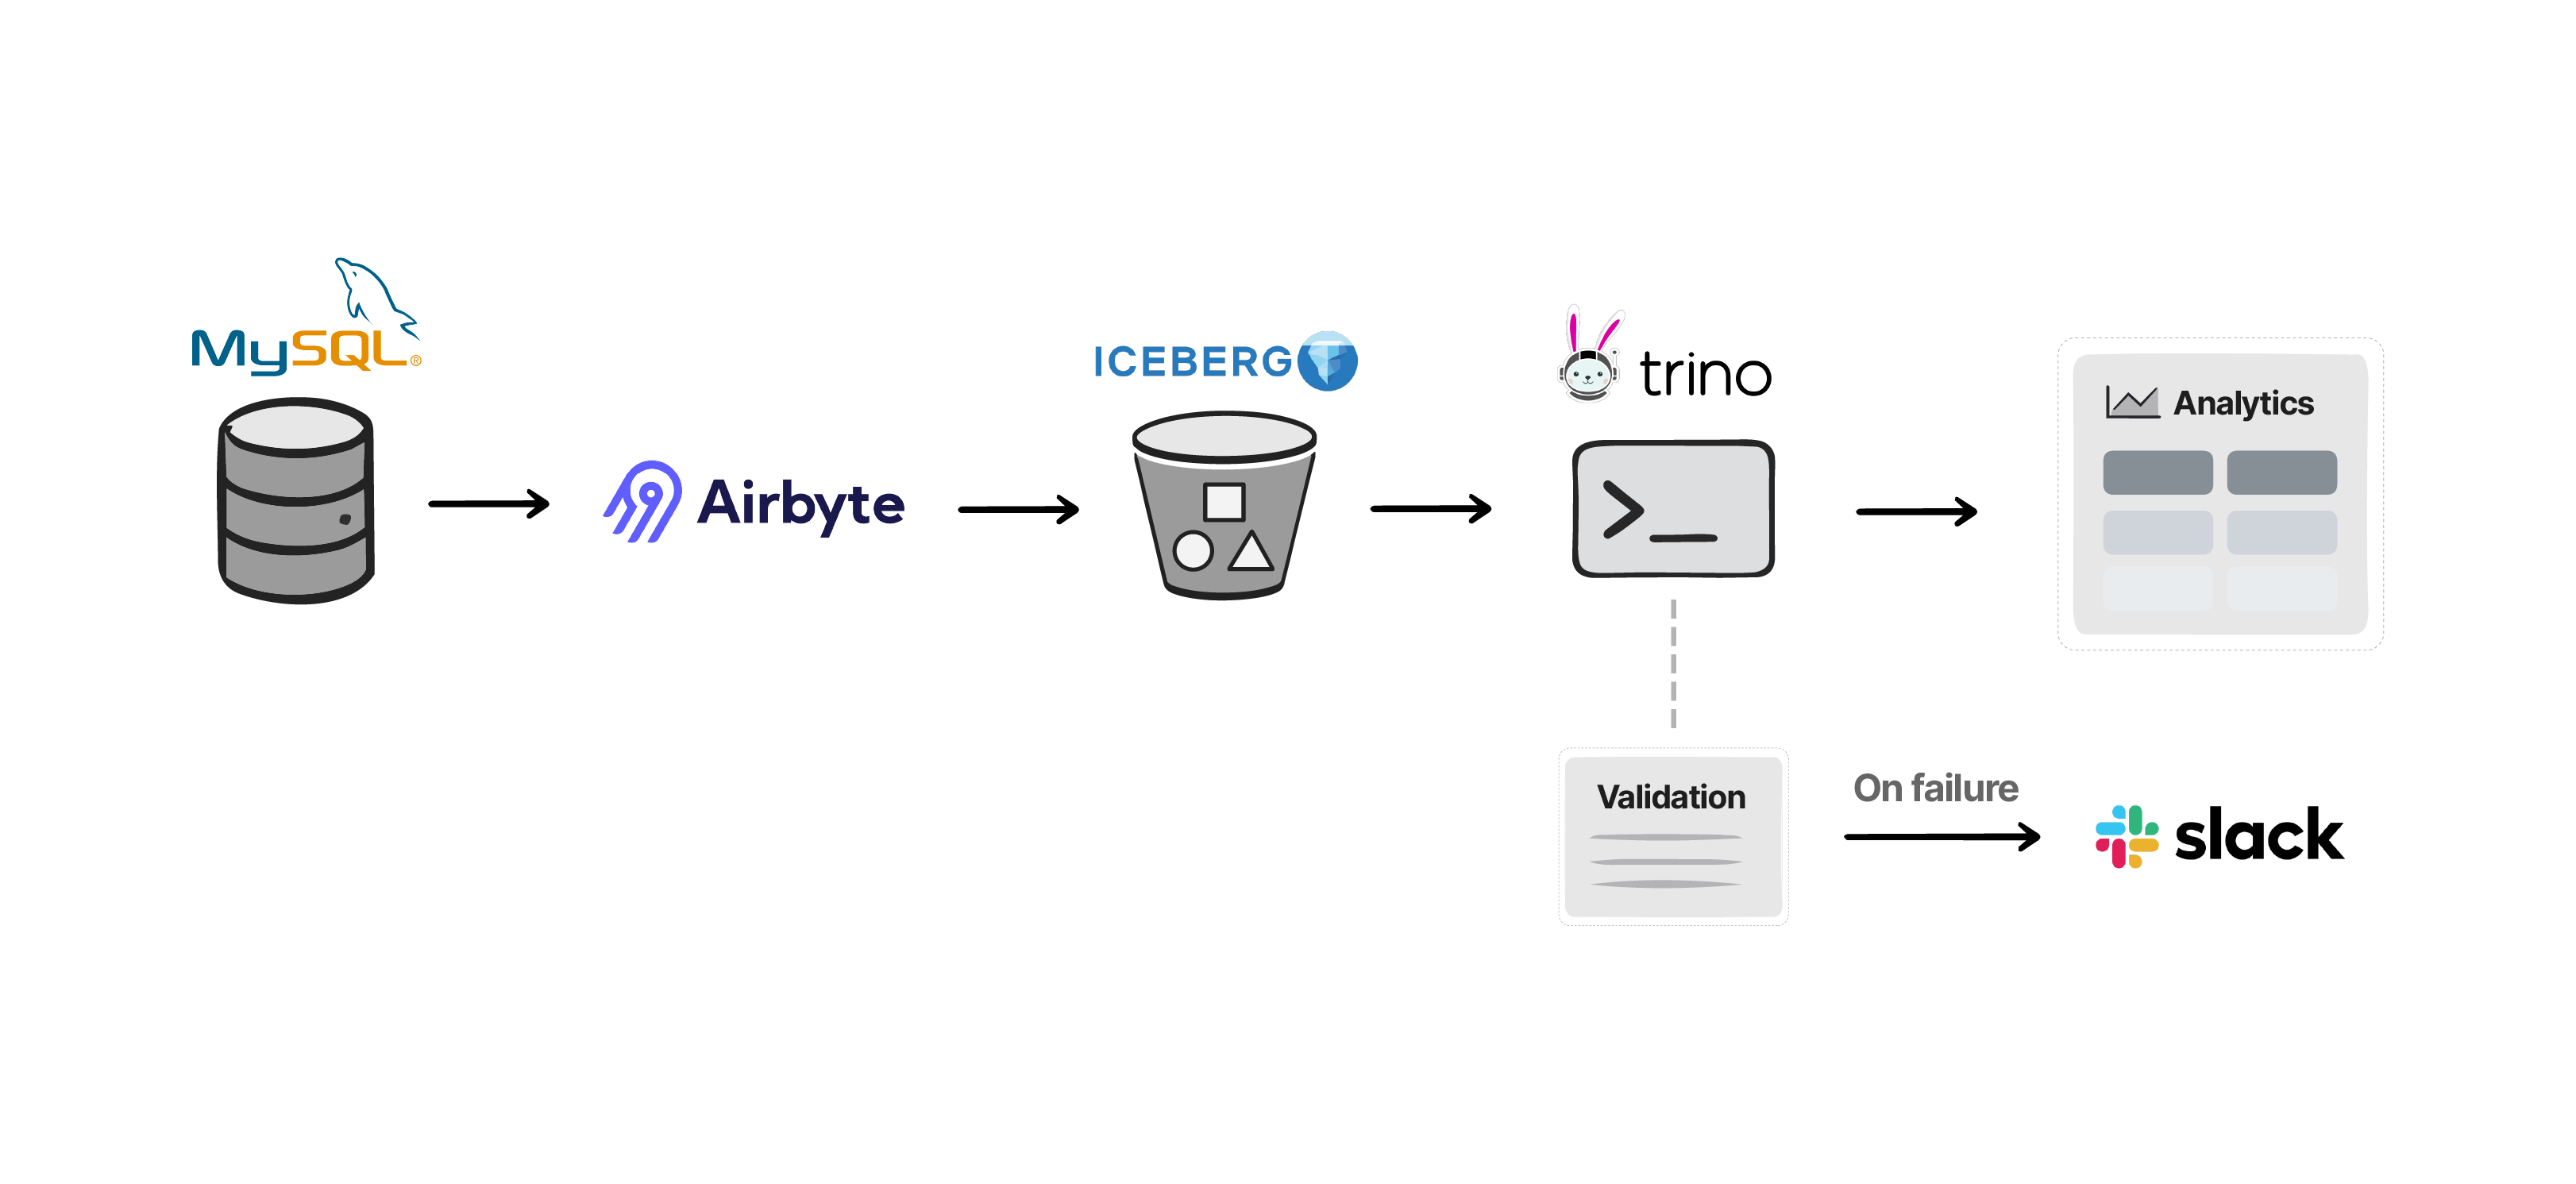
The Kubernetes cluster had roughly the same compute and RAM as the VM we started with. The difference was that Trino is built for distributed analytics, so it processed the data in parallel. Queries that used to hang for 40 to 50 minutes without returning finished in under 10 minutes, and we could iterate quickly again.
We also built validation into the pipeline. Before transforming, checks ran for null values in critical fields and for referential integrity issues, such as records pointing to rows that no longer exist. If something was wrong in the source data, the pipeline stopped and reported the issue.
After transforming, we checked that row counts matched, so no rows went missing because a column was empty. When validation failed, the pipeline generated a CSV report and posted it to SPARSH’s Slack.
Incremental loading works for most scenarios, but it assumes clean data. Once fields like created_at go missing, which is common in real-world hospital data, it stops being reliable. Change data capture doesn’t need those columns, and it makes near real-time analytics possible.
Transactional databases like Postgres hit a limit beyond a certain scale. When an analytical query computes over the whole dataset, it needs vectorized execution, which processes many values in a single operation, and an OLTP system isn’t built for that. Indexing and tuning didn’t help with around 150 GB of data in poorly indexed fields.
Running validation ahead of the transformation caught bad source data before it reached the analytics tables, which saved time and money.
We designed for the terabytes SPARSH expected within a few years, well beyond the 150 GB we started with.
That doesn’t mean every use case needs Iceberg and Trino upfront. Start simple, and move to purpose-built analytics tools once that stops scaling.
If you’re running into similar problems with your own health data, or want to talk through a use case, book a free call with us. We’re happy to help.
Synthea generates brilliant synthetic patient data, but only in US Core. HiGHmed needed it in Germany's MII profiles. Here is how we rebuilt it. Fully open source.

This project breakdown looks at how we built Tip2Toe, a rare disease phenotyping application for Karolinska University Hospital.

Here's how Medblock's partnered with Clinikk to build a longitudinal, openEHR-based EHR that supports their novel subscription-based care model.
No comments yet. Be the first to comment!