Widgets
Widgets provide a visual representation of data and can be incorporated onto the patient overview page to showcase patient-related information.
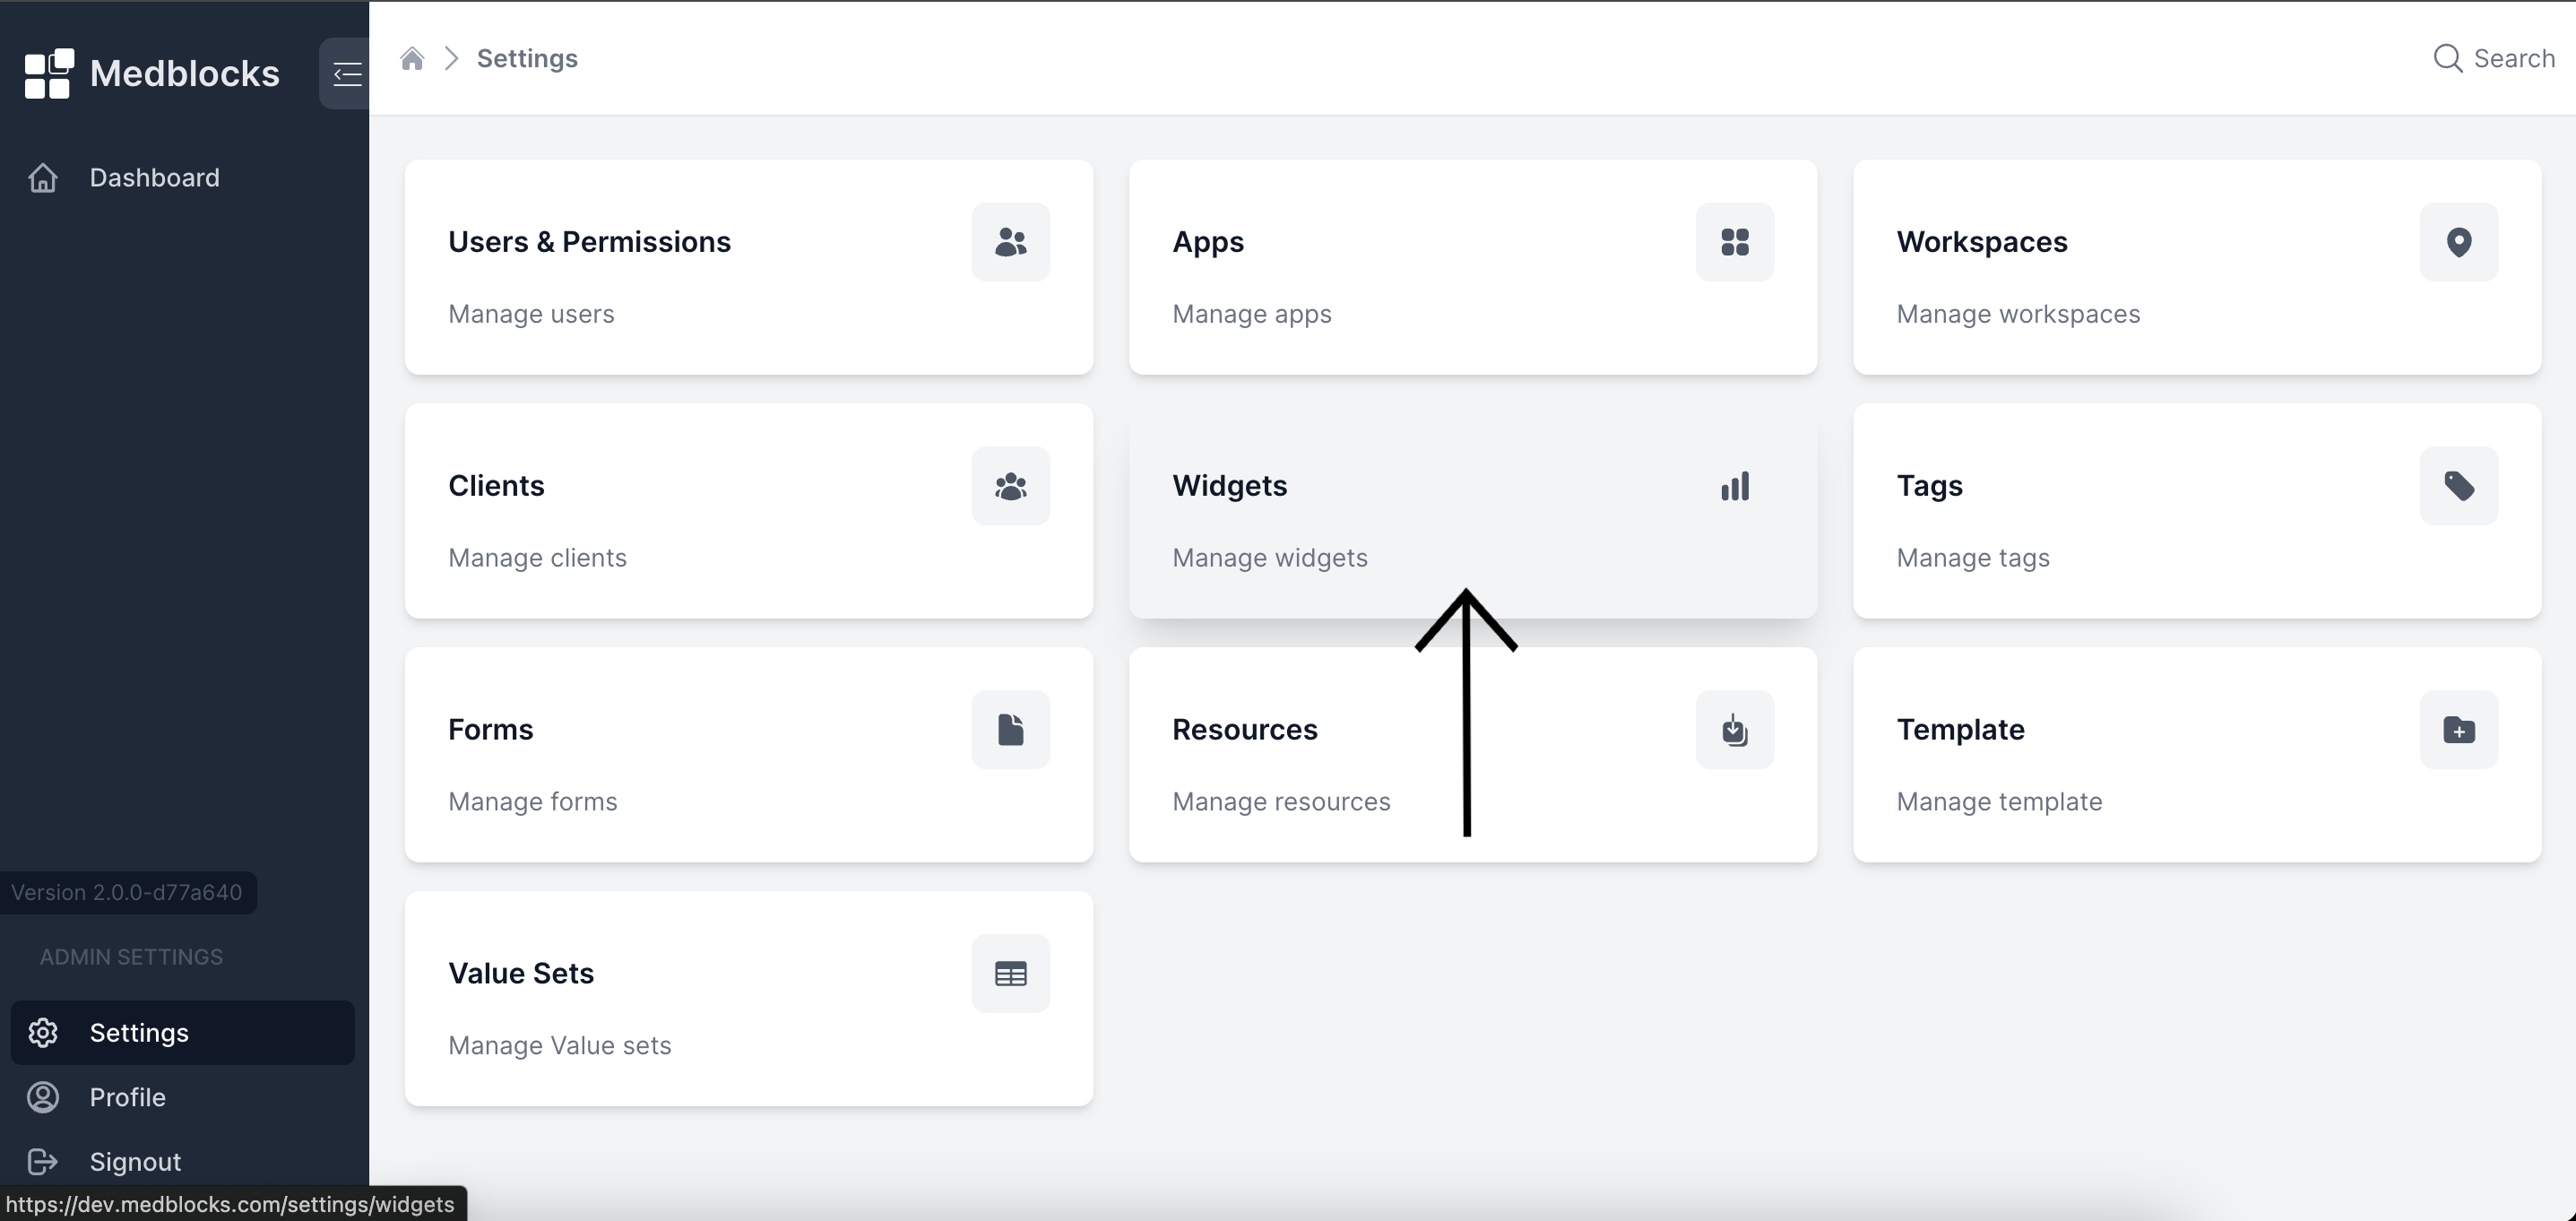
Usage
Navigate to the "Widgets" section within the settings page.
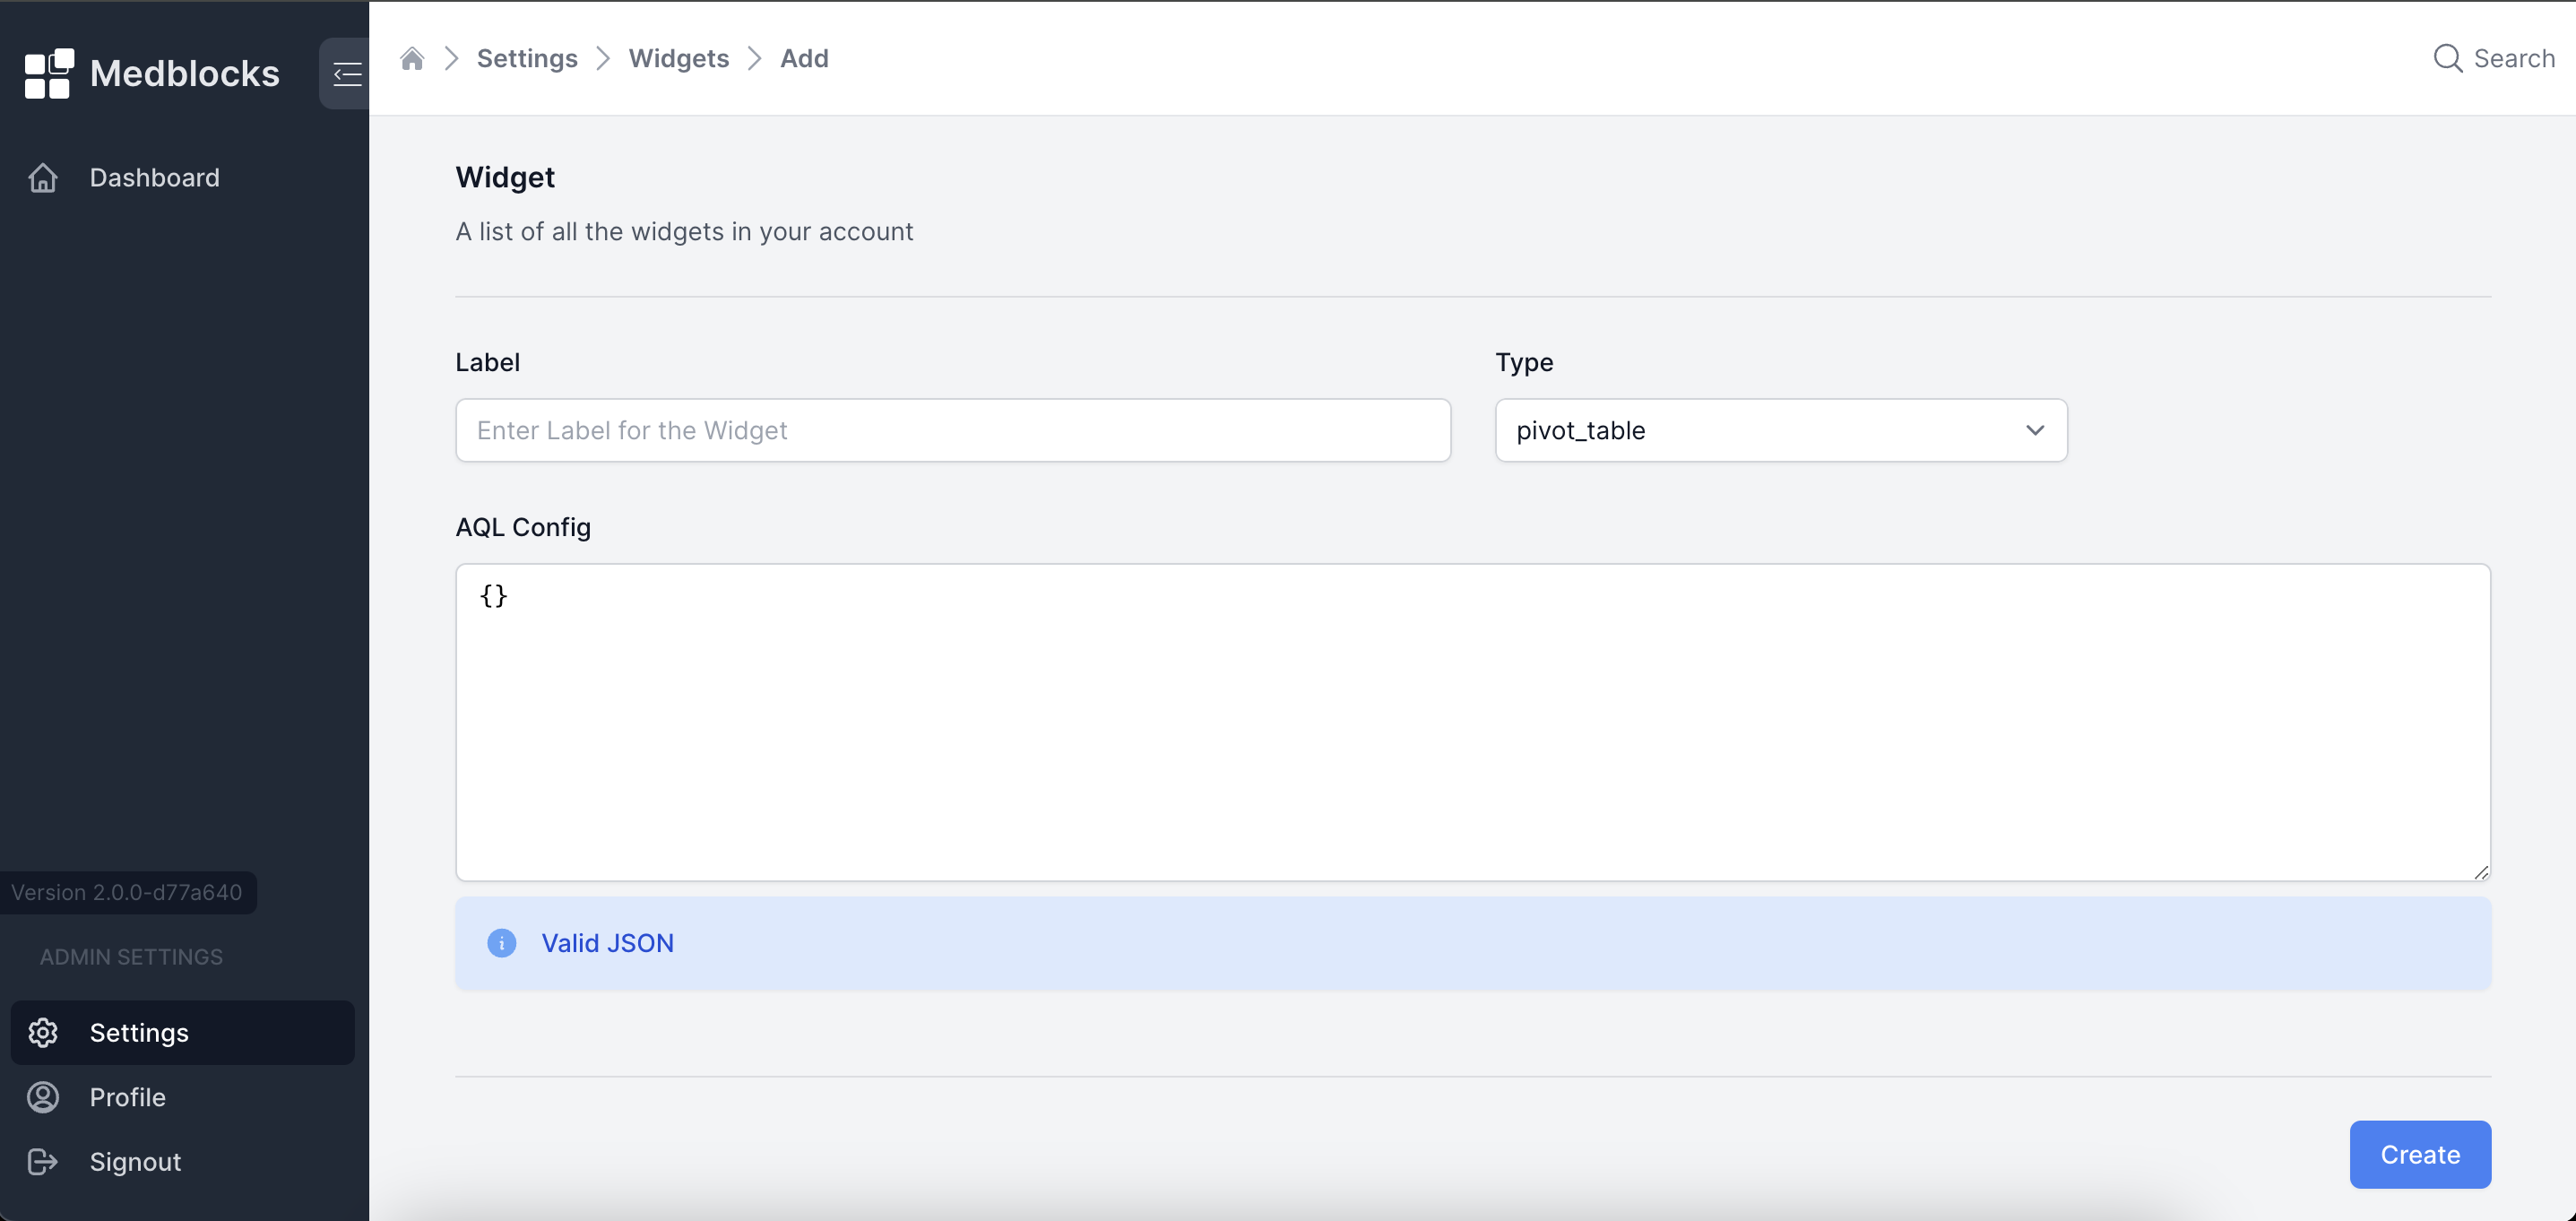
Each widget requires the following parameters:
- Label - Displayed label on the graph.
- Type - Types determine how the data has to be represented. Three possible types include line chart, simple table, and pivot table.
- Aql Config - Configuration object to query openEHR for necessary data.
Our dashboard offers three types of widgets:
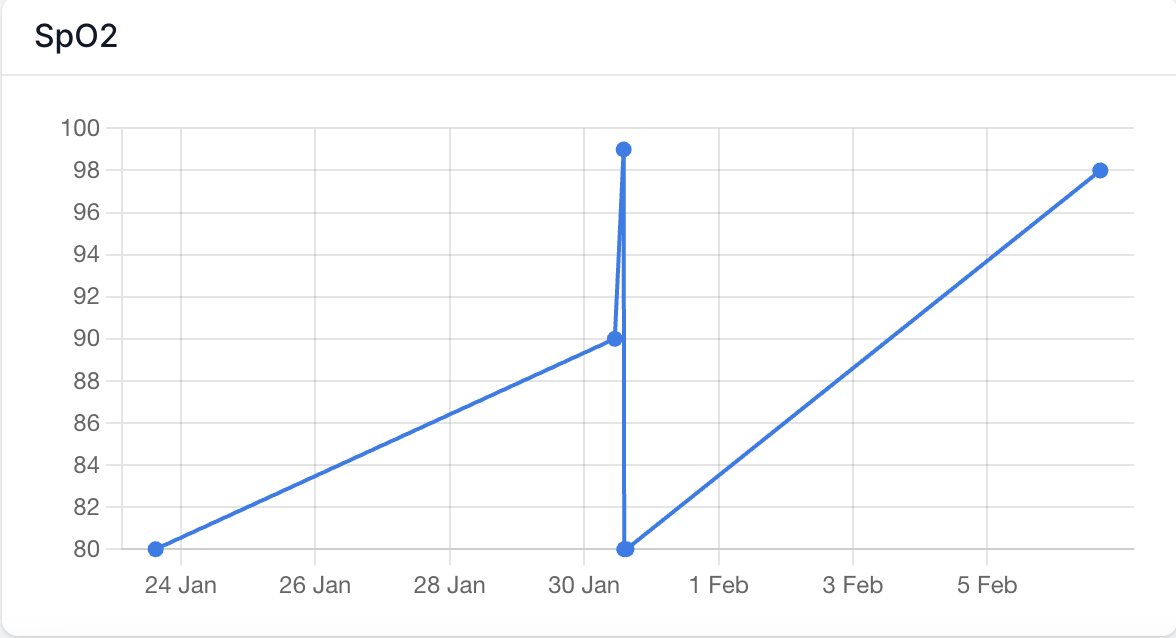
- Line chart : Represents patient data as data points connected by lines. The image below illustrates an SpO2 line chart relative to a patients encounter dates.
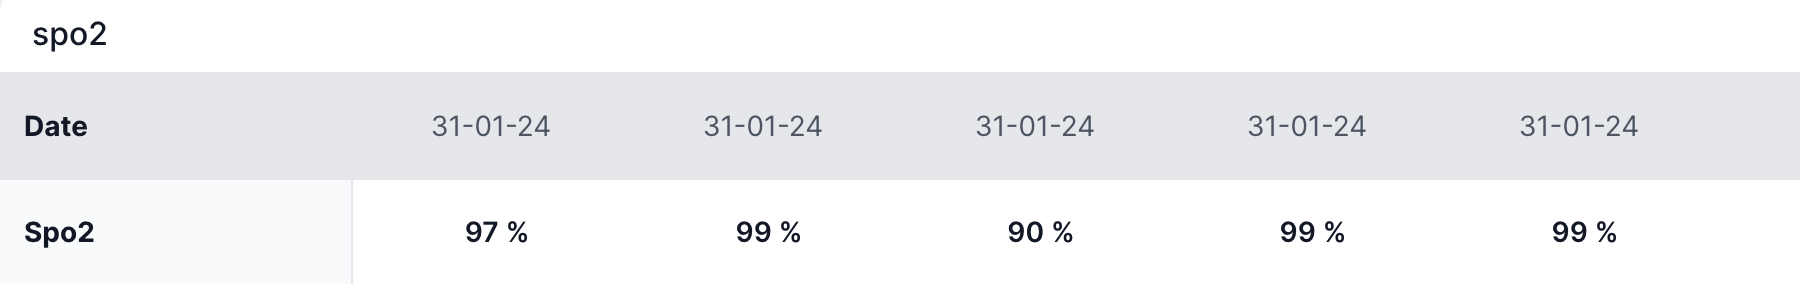
- Pivot table : Displays a horizontal scrollable table with one or more fields. Below is an example of a pivot table showing patient encounter dates and corresponding SpO2 readings.
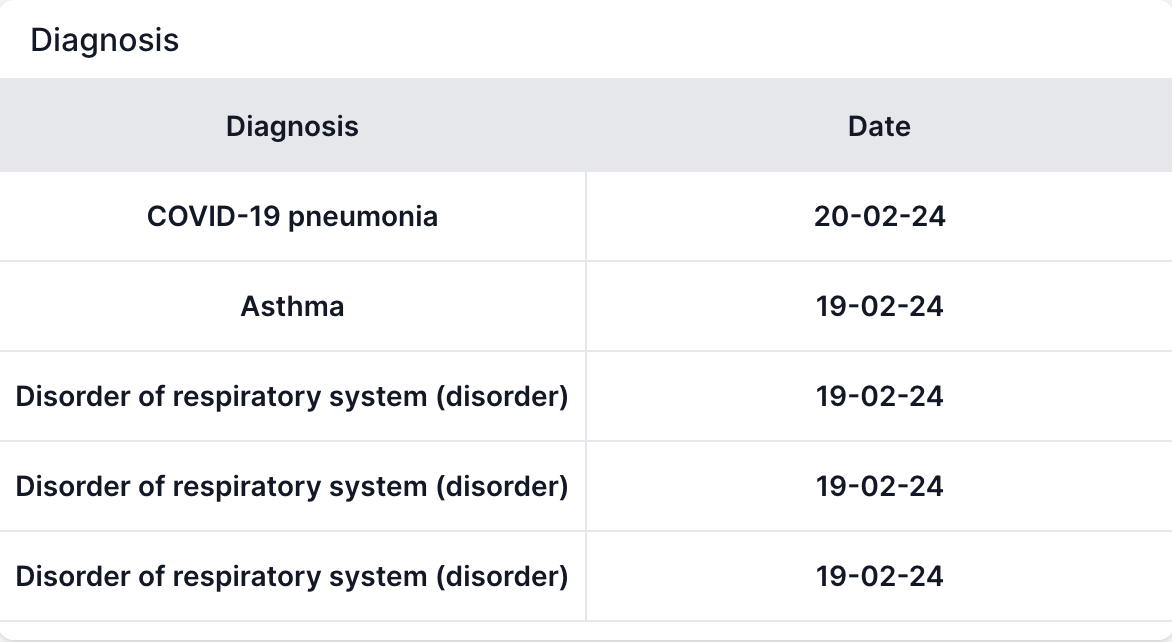
- Simple table : Shows a vertical scrollable table containing one or more fields. The image below demonstrates a simple table indicating patient encounter dates and diagnosed diseases.
Examples
To display the latest SpO2 reading in a line chart widget, configure the AQL Config as follows:
- Label - SpO2
- Type - line_chart
- Aql -
{
  "aqlOrder": "c/content[openEHR-EHR-OBSERVATION.pulse_oximetry.v1]/data[at0001]/events[at0002]/time DESC",
  "aqlWhere": "c/content[openEHR-EHR-OBSERVATION.pulse_oximetry.v1]/data[at0001]/events[at0002]/data[at0003]/items[at0006]/value!='null'",
  "aqlContains": "COMPOSITION c CONTAINS OBSERVATION",
  "aqlSelectUid": "c/uid/value",
  "aqlSelectTime": "c/content[openEHR-EHR-OBSERVATION.pulse_oximetry.v1]/data[at0001]/events[at0002]/time",
  "aqlSelectValue": [
    "c/content[openEHR-EHR-OBSERVATION.pulse_oximetry.v1]/data[at0001]/events[at0002]/data[at0003]/items[at0006]/value as spo2"
  ]
}
To display the latest diagnosis in a simple table widget, configure the AQL Config as follows:
- Label - Diagnosis
- Type - simple_table
- Aql -
{
  "aqlOrder": "c/context/start_time/value DESC",
  "aqlWhere": "c/content[openEHR-EHR-EVALUATION.problem_diagnosis.v1]/data[at0001]/items[at0002]/value/value IS NOT NULL",
  "aqlContains": "COMPOSITION c",
  "aqlSelectUid": "c/uid/value",
  "aqlSelectTime": "c/context/start_time/value",
  "aqlSelectValue": [
    "c/content[openEHR-EHR-EVALUATION.problem_diagnosis.v1]/data[at0001]/items[at0002]/value/value as Diagnosis",
    "c/context/start_time/value as Date"
  ]
}
To display the latest SpO2 readings in a pivot table widget, configure the AQL Config as follows:
- Label - SpO2
- Type - pivot_table
- Aql -
{
  "aqlOrder": "c/content[openEHR-EHR-OBSERVATION.pulse_oximetry.v1]/data[at0001]/events[at0002]/time DESC",
  "aqlWhere": "c/content[openEHR-EHR-OBSERVATION.pulse_oximetry.v1]/data[at0001]/events[at0002]/data[at0003]/items[at0006]/value!='null'",
  "aqlContains": "COMPOSITION c CONTAINS OBSERVATION",
  "aqlSelectUid": "c/uid/value",
  "aqlSelectTime": "c/content[openEHR-EHR-OBSERVATION.pulse_oximetry.v1]/data[at0001]/events[at0002]/time",
  "aqlSelectValue": [
    "c/content[openEHR-EHR-OBSERVATION.pulse_oximetry.v1]/data[at0001]/events[at0002]/data[at0003]/items[at0006]/value as spo2"
  ]
}
Permissions
Go to the Users & Permissions section of the settings page.
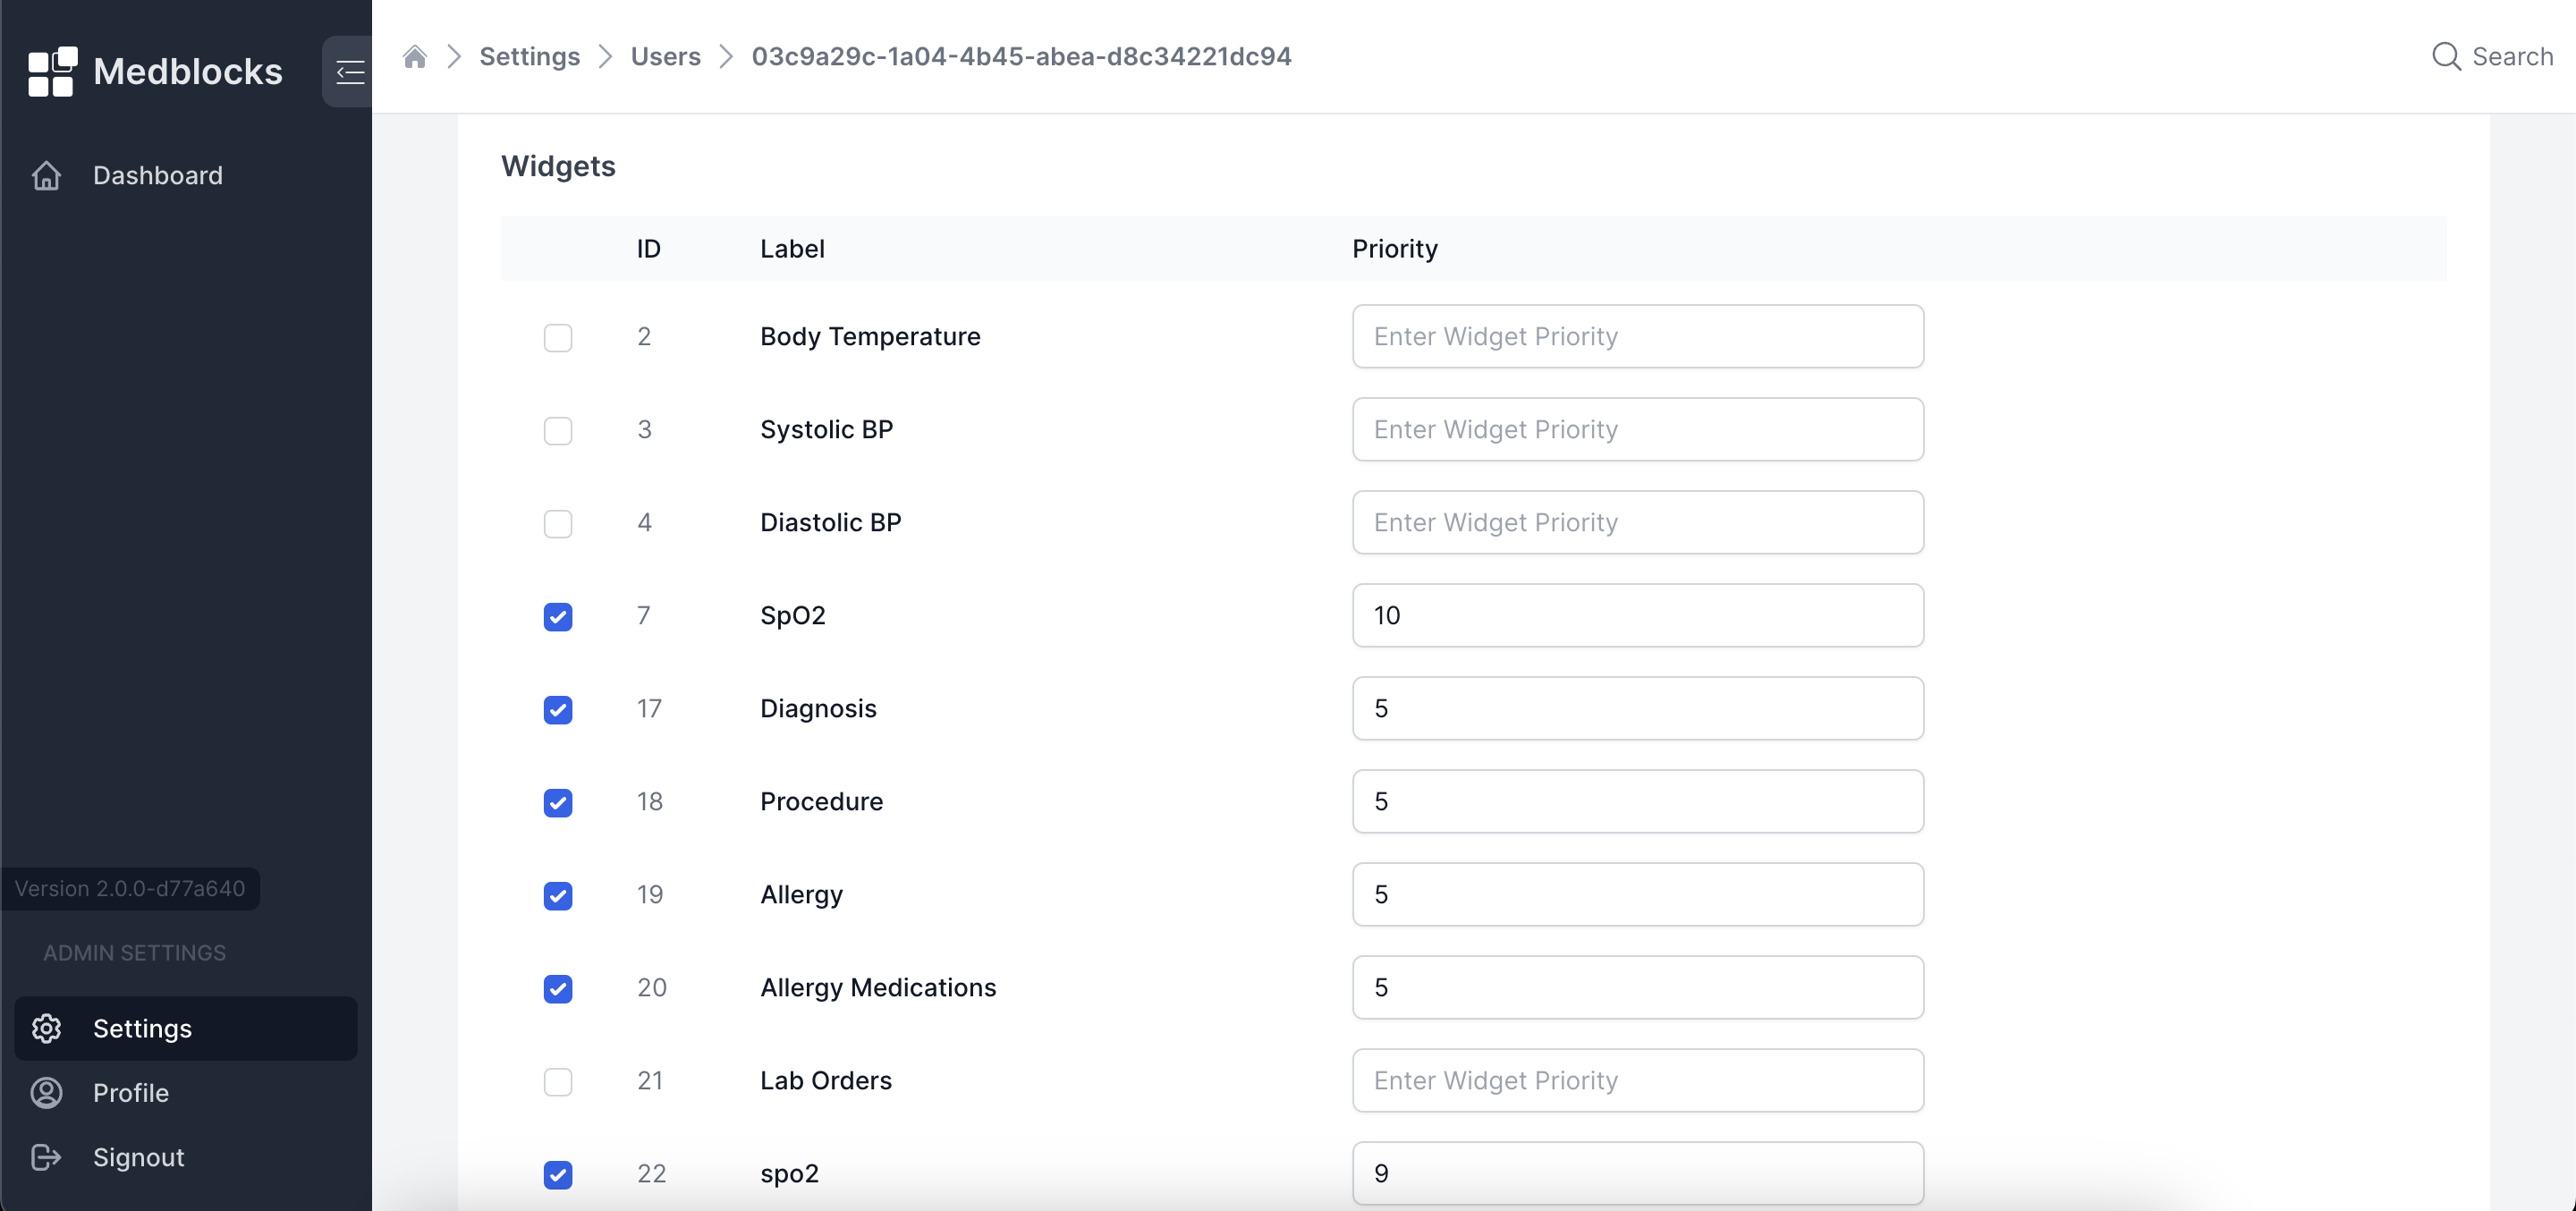
To grant permissions to widgets, select the widgets a specific user should have access to on the dashboard. You can also set the priority of widgets, determining the order in which they are displayed on the patient overview page.